


Measuring the small water cycle : The water trackers part II
More usefulness from isotopes


This is the second essay in The Water Trackers series. First essay is “The hidden langauge of water and matter : The water trackers part I”. The following essay is maybe easier to understand than part I. A good sequence might be to read part I after reading this essay, and its appendix.
…………..
Eneas Salati was worried.
In the 1970s, in Brazil there were widespread development projects. Developers were cutting down a lot of the Amazon to make way for farms. Salati, was a Brazilian researcher, who thought that deforestation would affect the region’s water balance, which could then affect the climate and rain. Salati feared that cutting down the Amazon forests would cause the rain to lessen.
Salati wanted to find observational evidence that precipitation-recycling/small-water-cycle was real — that lakes were evaporating and trees were transpiring to create rain. If he could find evidence for this, then maybe he could convince developers and the government to not chop down so much nature. Some climate models at the time had already suggested that the small water cycle effect was significant, but the insufficient hydrological data to input into these models cast doubt on their correctness.
How was he going to find observational evidence for this, though? Because water vapor is invisible, it’s hard to see how much of it is ascending as evapotranspiration, and it’s hard to track how that water vapor becomes rain.
Salati had an idea. He had been working with a mass spectrometer, which had recently been introduced to Brazil, on a number of isotope ratio projects. He had tracked the flow of nitrogen through the soil as fertilizer, then through plants, and into the ecosystem. The isotope ratio of the nitrogen changes as it moves through the system, leaving behind a bread crumb trail. He was also tracking the flow of water through geological formations and looking at how the isotope ratios of the water changed as it moved from one form to another.
Previous researchers had pointed out that as ocean air was blown inland, the heavier water vapor molecules would drop out preferentially over lighter molecules when it rained, leading to a lighter isotope ratio. Salati took this idea a step further. His idea was to quantify how much this drop in the ratio should be if there were no water vapor from evapotranspiration being added to the ocean air blowing inland, and compare it to what would happen if evapotranspiration was contributing to the rain.
He looked at the isotope ratios of the rain as it moved inland. Isotope ratios are written in relation to a sea water standard. So if the isotope ratio is the same as sea water it is written as 0. If it is less then it takes a number a negative number so e.g. ike -2 means the isotope ratio is 2 thousandths less than the sea water ratio. Here are the numbers he found for the rain, with each town being further inland. Behlem -5.0 , Taperinha -5.2, Manaus -4.2, Benjamin Constant -4.9, Cruizeiro de Sul -7.2 . He plotted this on a graph, with the coast and Belem on the right, Cruizeiro de Sul on the left. [Salati 1979].

The drop in the values was not as steep as it might be. This meant that evapotranspiration was significantly adding to the rain. It looked like Salati had found evidence for the small water cycle!
Next Salati wanted to know if there were seasonal changes to the small water cycle. April to June is the end of the wet season, beginning of the dry season. When he plotted the points he found that there was not as much precipitation recycling as there were in yearly averages. The expected values are a little lower than actual measured.

When he looked at July to September, which is the beginning of the switch to the wet season, he found much more precipitation recycling. In the graph the dashed line that says Rayleigh (for Rayleigh distillation) is the line of what the isotope ratio would be with no small water cycle. Because the values measured in the rain are all much higher, it means that there is significant evapotranspiration going on to replenish the heavier water isotopes into the inland wind.

He also found out that the October to December months also had a significant small water cycle.
In follow up papers, Salati and his colleagues figured, from the isotopic data, that about half of the rainfall in the Amazon was from precipitation recycling [Matsui 1993], which corroborated previous estimates from climate models.
Salati was the first person to actually measure the small water cycle/precipitation recycling, as contrasted with just calculating it from climate models. ''I think we have shown that the water and energy balance - the life support system - of a land area depends on the kind of cover you have on the land.''
Later his team found that the trees transpire 300 liters a day of water. His work helped characeterize how the flying rivers, which are low-level jet streams that swell in volume as they gather the water from the forests, hit the Andes and turn south into Bolivia, Paraguay, and parts of Brazil São Paulo, Minas Gerais, Mato Grosso to Paraná. These flying rivers brought rain to other parts of South America.
In latter years, Salati became known as the father of the flying rivers. “He was a pioneer in showing that the forest is a crucial climatic factor in its own maintenance. Thus, the Amazon isn’t a mere response to the climate, it also modifies the climate and creates the conditions for its own permanence,” Carlos Nobre, a researcher at the USP Institute for Advanced Studies said of Salati.
Salati helped create a movement to study the Amazonian forest and precipitation recycling. Just like fruit flies became the model research organism for various biological studies, the Amazon became the model research subject for precipitation recycling. After him came a cascade of researchers looking at how rain was recycled in the Amazon - Matsui, Lovejoy, Nobre, Eltahir, Bras, Brubaker, Spracklen, Burde, Burdash, Baker, da Silva, Rocha, Lettau, Marengo, Dominguez, Dirmeyer, Eiras-Barca, Kumar, Gimeno, Yang, Chug, Ramos, Martinez, Makarieva, Schleussner, Zemp, Enciso, Silva-Dias, van der Ent, Swann, Limberger, Lima, Lemes etc (to read their papers type in their names on Google Scholar).
Rong Fu, a UCLA meteorologist, proposed that the Amazon wet season was triggered by mass transpiration of water by trees , which would result in thunderstorms that trigger large scale air circulation patterns bringing in ocean moisture, at the end of the dry season. She and colleagues measured the isotope ratio, in a similar way to Salati, but with more sophisticated remote sensing methods, to show that this was the case. Makarieva and Gorshkov would also propose a similar triggering of the wet season by transpiration, only their mechanism was that of the biotic pump.
………
Scientists have since applied Salati’s isotope methods to study various ecosystems worldwide, exploring how land cover, vegetation, and water bodies influence rainfall patterns. By analyzing isotopic data, Gabriel Bowen, of University of Utah, found that up to 32% of aquifer recharge and 18% of rain originated from the Great Lakes, highlighting the importance of regional water recycling.
In Asia, Tsung-Ren Peng of the National Chung Hsing University in Taiwan, and his colleagues, adapted isotope techniques to examine the role of transpiration and evaporation in rainfall. To do so they had to track the various air masses blowing into Taiwan, and how each interacted with the precipitation recycling. Their studies revealed that in mountainous regions, rain comprised 63% moisture from wind, 36% from transpiration, and 1% from evaporation. In the plains, the contributions were 69%, 29%, and 2%, respectively. They also discovered that a process where raindrops partially evaporate before reaching the ground influenced the isotopic ratios. [Peng 2011]

[The arrows show the different air masses blowing in to Taiwan. From Peng 2011 ]

The Tibetan Plateau provided another case study. There are different ways that moisture is brought in by wind patterns. One is via regional circulation caused by the heating of the land heats which initiates convection. A second is via frontal rain, which comes from air masses that has travelled long distances. When a cold air mass collides with a warm air mass, or vice versa, rain can ensue. Researchers looking at the isotope information in the Tibetan Plateau determined that frontal systems were bringing in water vapor from evapotranspiration that happened outside the region, while regional circulation was bringing in water vapor from evapotranspiration that happened inside the region. The moisture recycling added about 30-80% to the rain. [Kurita 2008]
In North-eastern India, Ganguly [2023] used hybrid isotope methods to analyze monsoon rains. His research found that during the monsoon season, moisture recycling contributed 38% of rainfall, increasing to 67% during the post-monsoon season. These studies illustrate the pivotal role of precipitation recycling in regions heavily reliant on seasonal rainfall for agriculture and water security.
…
As global water shortages worsen, understanding the small water cycle has become increasingly urgent. The ability to track water’s journey through isotopic “fingerprints” enables scientists to identify the sources of rainfall and evaluate the impacts of land use changes.
In the U.S., isotope gradients from the western coast inland reveal how heavier oxygen isotopes drop out as rain, with lighter isotopes remaining further inland. Anomalies in these gradients suggest contributions from new water vapor, such as evapotranspiration from vegetation. Such insights can guide strategies to restore degraded landscapes and improve regional water cycles. The Colorado River might face collapse in two or three decades if we do not figure out how to replenish it by restoring the small water cycle.
In the diagram below, blue means lighter water isotopes, while red is heavier. We would like our eco-restoration efforts to result in a lessening of the isotope gradient for paths inland, indicating more precipitation recycling. These isotope maps can thus be a metric of progress.
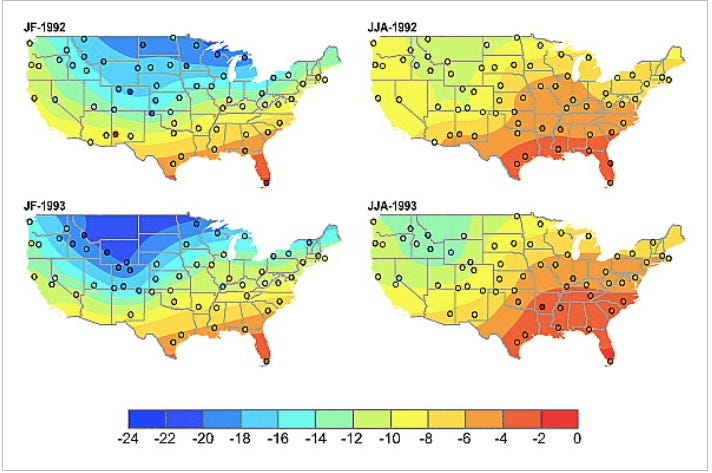
[Liu 2010 “Atmospheric circulation is reflected in precipitation isotope gradients over the conterminous United States”. ]
The Iberian Peninsula offers another example, where isotopic data highlight how winds from the Mediterranean bring moisture inland, with isotopes becoming lighter as rain progresses westward. Efforts to restore vegetation, wetlands and groundwater in these regions could reduce the isotopic gradient, indicating enhanced summer precipitation recycling. This approach can help increase water security in arid and semi-arid regions.
In the map of Iberia below, the red shows heavier isotope ratios. As we move inland, the map turns orange, yellow and green indicating lighter isotope ratios. We would like restoration efforts to lessen the color gradient.

Learning to read isotope information is similar to learning to read a code. (See appendix for more information). This skill can be quite useful for projects in your watershed, bioregion, or even across your continent. Isotopes can reveal how water cycles through soil, plants, rivers, lakes, groundwater, and the atmosphere. Publicly accessible isotope information is available on platforms like waterisotopes.org and GNIP (Global Network of Isotopes in Precipitation/Rivers). You can take water samples and send them to a lab for analysis. (The YouTube channel Isocamp has a lot of educational information on isotope reading.)
Salati’s legacy continues to inspire a new generation of scientists. His work transformed the Amazon into a living laboratory for studying the small water cycle, laying the groundwork for breakthroughs in hydrology, climatology, and environmental science. His precipitation recycling isotopic methods have greatly enhanced our understanding of the small water cycle.
…
This is a reader supported publication. Thank you to all who financially contribute, and to all who subscribe in any form, and read these essays. And thank you to all who are working to restore water cycles around the world.
Appendix:
How reading isotopes is like a card game
Let’s say there are a huge number of cards sorted into many different piles, all face down. There are rules governing how the cards are passed from one pile to another. The goal of the detective is to figure out how the cards are being passed and how many of them are being passed, just by looking at the cards in each pile. The piles are analogous to water samples from groundwater, plant xylem, soil water, atmospheric water vapor, precipitation, lakes, and rivers. The movement between piles is analogous to water moving from one body to another—for example, from a lake to the air.
In our analogy, we can imagine the black royals as representing the heavier deuterium isotopes of water, the red royals as the heavier oxygen isotopes of water, and the number cards of both colors as the normally weighted H₂O molecule. We figure out the rules for how different processes affect the ratio of black royals to red royals as they are passed around. Then we examine the makeup of each pile to deduce how many cards were passed to it from other piles.
One can track the ratio of black royals to number cards or red royals to number cards, which would be analogous to tracking isotope ratios. One can also follow the extra black royals being passed around, which is analogous to following something called deuterium-excess. Additionally, one can measure the ratio of black royals to red royals, which is analogous to measuring the slope of something called the Local Meteoric Water Lines.
There are three basic equations related to tracking isotopes. The first is a water balance model, which keeps track of isotope input and output in different areas. The second equation describes how isotopes change as water moves from a body of water to the atmosphere, which depends on the air's humidity (this is known as the Harmon-Craig model). The third equation tracks how wind loses heavier isotopes, a process described by Rayleigh distillation.
References
Bowen, Gabriel J., Casey D. Kennedy, Paul D. Henne, and Tonglin Zhang. "Footprint of recycled water subsidies downwind of Lake Michigan." Ecosphere 3, no. 6 (2012): 1-16
Ganguly, Akash, Harsh Oza, Virendra Padhya, Amit Pandey, Swagatika Chakra, and R. D. Deshpande. "Extreme local recycling of moisture via wetlands and forests in North-East Indian subcontinent: a Mini-Amazon." Scientific Reports 13, no. 1 (2023): 521.
Hatvani, István Gábor, Dániel Erdélyi, Polona Vreča, and Zoltán Kern. "Analysis of the spatial distribution of stable oxygen and hydrogen isotopes in precipitation across the Iberian Peninsula." Water 12, no. 2 (2020): 481
Kurita, Naoyuki, and Hiroyuki Yamada. "The role of local moisture recycling evaluated using stable isotope data from over the middle of the Tibetan Plateau during the monsoon season." Journal of Hydrometeorology 9, no. 4 (2008): 760-775
Liu, Zhongfang, Gabriel J. Bowen, and Jeffrey M. Welker. "Atmospheric circulation is reflected in precipitation isotope gradients over the conterminous United States." Journal of Geophysical Research: Atmospheres 115, no. D22 (2010)
Martinez, J. Alejandro, Francina Dominguez, and Gonzalo Miguez-Macho. "Impacts of a groundwater scheme on hydroclimatological conditions over southern South America." Journal of Hydrometeorology 17, no. 11 (2016): 2959-2978
Matsui, Eiichi, Eneas Salati, M. N. G. Ribeiro, C. M. Reis, A. C. S. N. F. Tancredi, and J. R. Gat. "Precipitation in the Central Amazon basin:-The isotopic composition of rain and atmospheric moisture at Belém and Manaus." Acta Amazonica 13, no. 2 (1983): 307-369.
Peng, Tsung‐Ren, Kon‐Kee Liu, Chung‐Ho Wang, and Kai‐Hsun Chuang. "A water isotope approach to assessing moisture recycling in the island‐based precipitation of Taiwan: A case study in the western Pacific." Water Resources Research 47, no. 8 (2011)
Salati, Eneas, Attilio Dall'Olio, Eiichi Matsui, and Joel R. Gat. "Recycling of water in the Amazon basin: an isotopic study." Water resources research 15, no. 5 (1979): 1250-1258
Another great read - wish I had known about 'flying rivers' when I was writing my biology textbooks. Have really enjoyed your posts this year, some quite a challenging read, but so informative and useful background to my understanding of what happens to water in my garden & farm. Thank you
I live in Northern Nevada and I know the Desert Research Institute is engaged in cloud seeding with Silver Iodide.
Do you think these projects have unintended consequences on the small water cycle?
I would imagine that causing rain without the accompanying humidity would cause there to be less rain down wind?
The increase of green cover and trees to encourage evapotranspiration seems like a more viable way to increase precipitation patterns than cloud seeding.