
Decoding our rain: disentangling ocean, land and trees

I was looking out across vast tropical green mountains yesterday and saw small, white, localized fog clouds hovering right above the trees. I’ve seen these in many other places too, like the hillside forests in Portugal, with their tendrils rising.
Sometimes people are disbelieving that trees could transpire enough to create clouds. Well, this is the visual evidence. We can see transpiration in action. It’s the forest’s transpiration and the soil moisture evaporating, all combining to generate so much moisture that it condenses right above the trees.
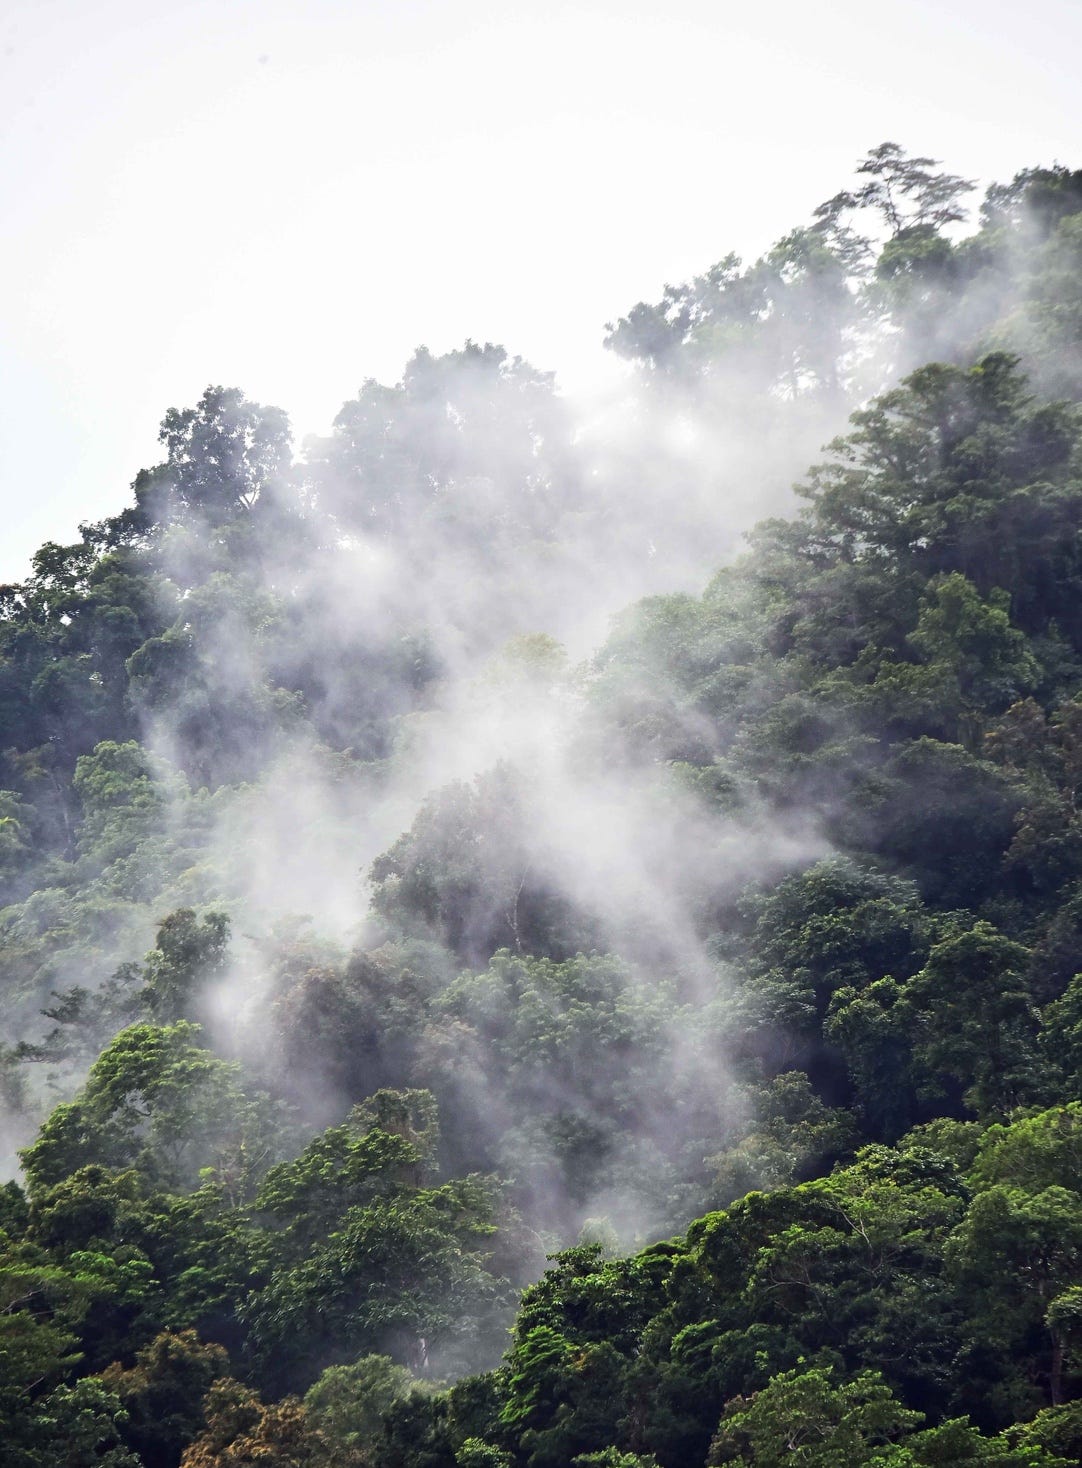
[photo: David Clode}
Here is a picture of this transpiration in action happening in Mt Whitfield in Queensland, Australia.
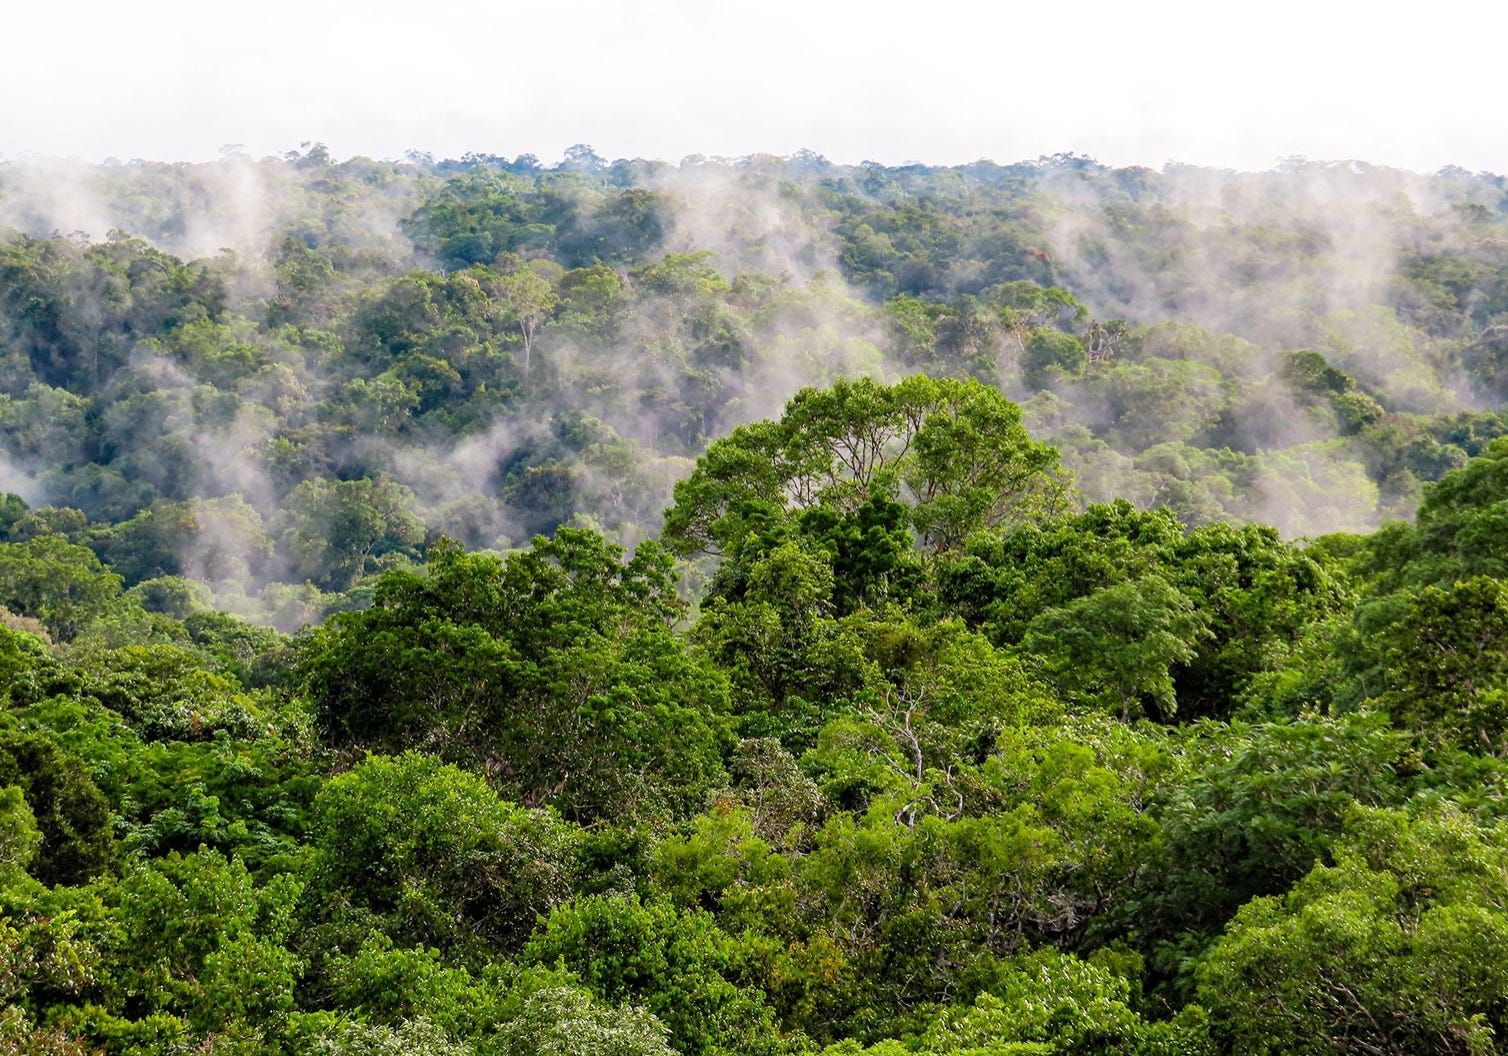
[from Matthew Abeler’s website].
Here’s a picture of transpiration in action in the Amazon. The Amazon transpires a mighty 20 billion tons daily.
Its not always the case though that we can tell where clouds come from. How much of it is caused by ocean moisture, how much from the land, from the small water cycle?
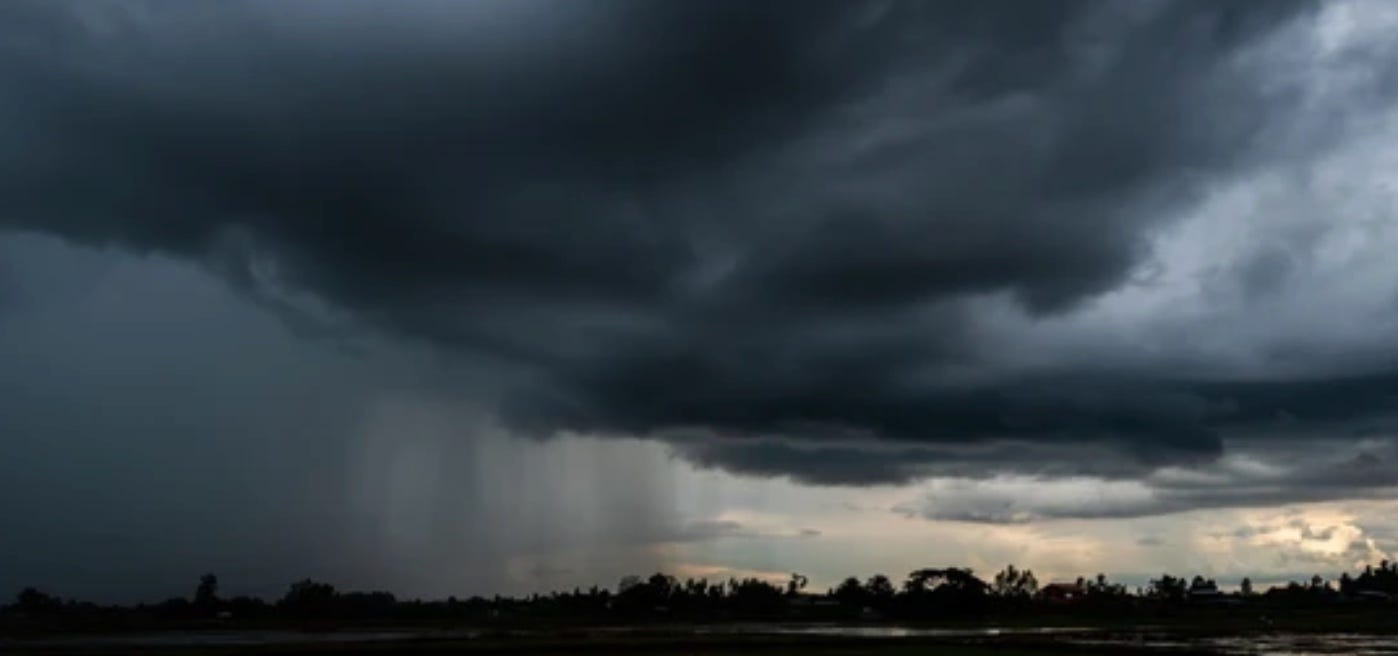
In this photo above, how do we figure out how much of that cloud comes from ocean moisture blowing inland, and how much from evapotranspiration from vegetation and soil?
Well, scientists have been coming up with a lot of clever tricks. They use statistical techniques to correlate rain with ocean temperatures and with how land-based precipitation recycling works. The amount that doesn’t correlate with the ocean is suggestive of another process at work. To do this, though, scientists first have to understand how oceans create rain.
Oceans create rain on land primarily through evaporation and atmospheric transport. When the sun heats up vast expanses of ocean water, massive amounts of moisture evaporate into the air. Prevailing winds and global weather patterns then pick up this water vapor and carry it across coastlines and continents. As these moisture-laden air masses move inland, they can be forced upward by rising topography like mountains (orographic lift), or they can collide with cooler air masses, causing the water vapor to cool, condense into clouds, and eventually fall as rain or snow far from where it originally evaporated.
It turned out that ocean basins were connected all across the world, with different patterns that would propagate via wind currents, etc. Amazingly, the sea surface temp in a particular ocean would often correlate with rainfall on other continents far away, whether it be Africa, the Americas, or Europe or Australasia. For instance, ENSO (composed of El Niño and La Niña) showed how changes in sea surface temperature in the Indian, Atlantic, or Pacific Ocean would ripple out via wind shifts across to all the different continents. To picture how it works: normally, steady trade winds blow from east to west, pushing warm water toward Asia and Australia while pulling up cold water off the coast of South America. During an El Niño, those trade winds weaken, and the pool of warm water sloshes back eastward across the Pacific, deepening the warm layer of water (the thermocline) in the east. Because that warm layer is now so deep, the ocean stops bringing up cold water, making the eastern Pacific unusually warm. The winds shift ocean temperatures over a period of time, the ocean warm waters move to one side, and these changes move across the globe, which then shift ocean temperatures in other ocean basins and ultimately shift rain on the land.
To make sense of the complexity of climate, scientists started identifying other quasiperiodic climate modes, such as the Indian Ocean Dipole, the Tropical North Atlantic, and the Madden-Julian Oscillation. By checking whether their quasi-periods matched, scientists could determine which rain was caused by which mode. They ran correlations between sea surface temperatures and rainfall; if the correlations matched and fit dynamical system models, they could track the cause.
So if we were to say try to understand what is happening to rain in the Sahel, we can look at how it correlates with sea surface temperatures in different ocean basin. Winds are generated when land warms up in the Sahel and Sahara, creating a low-pressure heat engine that draws ocean winds blowing in. The temperature difference between the North and South Atlantic oceans helps determine how that wind blows, and how strong and fast. These affect what are called mesoscale circulation systems. There are then these jets called African Low Level Jets and Tropical Easterly Jet, which are fast moving bands of air in the Sahel that intersect with the mesoscale system circulations to create rain. There are also winds blowing down from the Mediterranean Sea. When the Mediterranean heats up, more evaporation rises, and some of that water vapor gets blown down to the Sahara and Sahel.
Scientists look at the way these sea surface temperatures change then correlate it with patterns of rain in the Sahel. And the patterns of rain they create are different than those from the land recycling that water back up to the air, the small water cycle. So statistically they can look at these things. There’s been a wide variety of these statistical techniques to unravel these correlations.
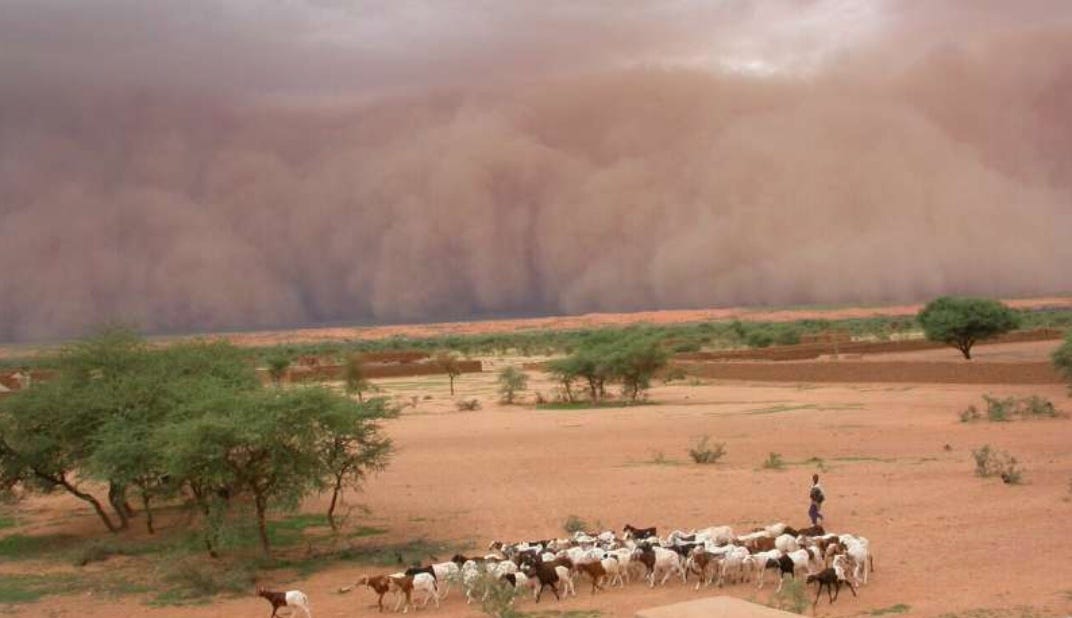
[rain storm in Sahel]
Yan Yu was a postdoc at Madison, Wisconsin, when she was trying to figure out how to tell whether changes in Sahel rainfall were coming from the ocean or from the land. What she used was a particular spatial temporal correlation technique (something called GEFA, or Generalized Equilibrium Feedback Assessment). Basically, the ocean and the land affect rainfall in different ways, so they leave different patterns in the climate system.
Land–atmosphere feedbacks have a different pattern. Vegetation and soil moisture can increase evapotranspiration, putting more water vapor into the atmosphere. That moisture can then be transported and contribute to rainfall. Because the land and ocean vary in different places and on different timescales, GEFA can statistically separate their contributions.
What she found was that during the peak monsoon season, oceanic forcing was more important for Sahel rainfall. But toward the end of the monsoon, the influence of the land became much more important. Terrestrial forcing explained about 8% of annual-mean precipitation variance, but this increased to roughly 18% during the late-to-post-monsoon season, when land-surface effects became comparable to or larger than oceanic effects.
And there is an interesting complication. The evapotranspiration (ET) from vegetation does two things at once. First, it puts more water vapor into the atmosphere, which can promote convection and rainfall which is the moisture-recycling pathway. But evapotranspiration also cools the surface. That cooling makes the atmosphere more stable, which can suppress the upward motion needed for convection and rainfall.
So there are actually two competing effects: ET to more atmospheric moisture to more rainfall versus ET to surface cooling to greater atmospheric stability to less convection to less rainfall.
At lower levels, turbulence in the air can mix and heat air near the surface. If a parcel of this warmed air rises high enough, it can continue rising because it is warmer and less dense than the surrounding air. Evaporative cooling reduces this warming, making it less likely that warmed air will continue rising. (Technically speaking, evaporative cooling can keep the boundary layer below the level of free convection, making it harder for air parcels to reach the height where they can rise freely and potentially form rain.)
They could see evidence for both effects in the observations. But Yu found that the moisture-recycling effect was stronger than the suppressive effect, so the net effect of increased vegetation was an increase in rainfall.
Rain does not arrive the same way everywhere on Earth. Different regions have developed different ways of pulling, carrying, and recycling water through the atmosphere.
In South Asia, for example, the Tibetan Plateau acts like a giant seasonal heat engine. As the land heats up in summer, it helps draw moist air northward from the Indian Ocean, contributing to the powerful Indian monsoon.
In the southwestern United States, a smaller-scale summer monsoon brings moisture northward into Arizona and surrounding regions. South America has a very different system. The Amazon rainforest is part of a vast network of “flying rivers,” where trees continually pump water from the ground into the atmosphere through transpiration. Winds then carry some of that moisture across the continent, allowing rain to fall, be recycled by forests, and travel onward again. The forest is not simply receiving rain—it is helping move the rain.
Europe has yet another arrangement. Its rainfall is shaped by the meeting of oceanic and continental influences: moisture-laden westerly winds arrive from the Atlantic, while seasonal heating of the European landmass and the Mediterranean helps shape where and when that moisture falls.
North America has another rhythm separate from the Arizona monsoons. In winter, storms carry enormous amounts of Pacific moisture into California and Oregon and then across the continent. Rather than being driven primarily by a sudden seasonal “suck” of air, as in a classic monsoon, this system involves a succession of atmospheric rivers, storms, and moisture transfers across the landscape.
It’s actually a common puzzle in different fields from economics, sociology, hydrology, planetary science, to ecology, to figure out what causes what. One field will develop a statistical technique, and then it will get appropriated by another field to use for its own studies. For instance, Principal Component Analysis (PCA) was originally developed in psychology to simplify complex webs of mental test scores and uncover underlying traits like general intelligence, before getting appropriated into climate science as EOF (Empirical Orthogonal Functions). In climate science, EOFs act like an analytical lens: scientists use them to break down massive grids of global weather data into dominant spatial maps and temporal time series. By running EOF analyses on both sea surface temperatures and regional rainfall, researchers can match the patterns and see if an ocean anomaly marches to the same drumbeat as land rainfall thousands of miles away. Economics has also been a leader in developing statistical techniques that then get borrowed by other fields, such as Granger causality - which was originally created by Clive Granger to figure out if one economic time series (like money supply) could reliably forecast another (like inflation or GDP). Climate scientists and hydrologists now use Granger causality to test whether land-surface conditions like soil moisture actively drive and predict subsequent rainfall. Statistics can sometimes be a bit of a shaky subject and easily misleading, so researchers have to be careful. Granger causality is sometimes misleading in economics, and there are ways it can miss things in climate science; however, it can still be a useful tool to help give us a sense of what is going on.
So by comparing the sea surface temp of different basins and understanding the ways these climate modes propagate around the world (teleconnections) and then studying them statistically, you can decompose precipitation into a land-atmosphere component versus an ocean-to-rain component. Then researchers run computer models to see if they get the same result. Sometimes the numbers are close to each other. But sometimes the numbers don’t always agree. In those cases there is more digging to do to understand what is going on. Even though the exact ratio of sea-rain coupling to land-rain coupling remains a puzzle waiting to be fully solved, what we do know is that global rainfall is a deeply interconnected dance: distant ocean temperatures steer atmospheric rivers and winds across entire planets, while local vegetation and soil moisture actively recycle water back into the sky to help fuel subsequent rainfall.
Yu, Yan, Michael Notaro, Fuyao Wang, Jiafu Mao, Xiaoying Shi, and Yaxing Wei. "Observed positive vegetation-rainfall feedbacks in the Sahel dominated by a moisture recycling mechanism." Nature Communications 8, no. 1 (2017): 1873.
Love this complex dance and patterns
We gotta make it a waltz where all humanity joins in. The music is the finest. The moves are so enticing.
"Water for all!", was qas happily sung as everyone was from no tribe except the tribe of all.